Forecasting your B2B SaaS Business is a predictor of your future revenue. It is used by your management team to make informed business decisions related to cash flow. Questions like:
- Are we going to hit our plan?
- Can we hire?
- Will we meet our covenants?
- Do we need more cash in the business?
Forecasting in your B2B SaaS business is extra hard
If you are selling a high-value ACV product (ex. $10,000 not $100) at relatively low volumes (dozens not thousands), your forecasting accuracy becomes especially difficult. One or two deals could swing your forecast wildly. The difference between hero to zero. Forecast accuracy works on both sides of the forecast number. Exceeded your forecast by 35%? Great, but you were still not accurate. Generally, you’ll want to be within 10-20% of your forecast number to be considered accurate.
Qualitative Forecast model
When dealing with a scarcity of data, most sales execs in the software world end up using a qualitative approach. This means they rely on expert opinion for lack of any relevant historical information. This is typical in the SaaS world where the product lifecycle is hyperactive and last year’s results have no barring on this year’s results for any number of reasons including macroeconomic factors, new features, new competitors, marketing efforts, flywheel affect, etc. Also, if you are dealing with dozens of transactions versus thousands, statistical methods are not relevant.
So the trick then becomes how to provide a qualitative forecast that removes as much gut bias as possible. How do you do take a logical approach to forecast?
Provide a Base and Stretch forecast
If you are in a room of 10 execs, I’m going to bet that the most optimistic among them is the VP of Sales. That optimism is hard to beat down when it comes to forecasting. It fights the very nature of your VP Sales’ being. To keep everyone happy, especially your conservative CFO, present two forecasts. A Base forecast which is your most conservative forecast, and a Stretch Forecast, you’re most aggressive.
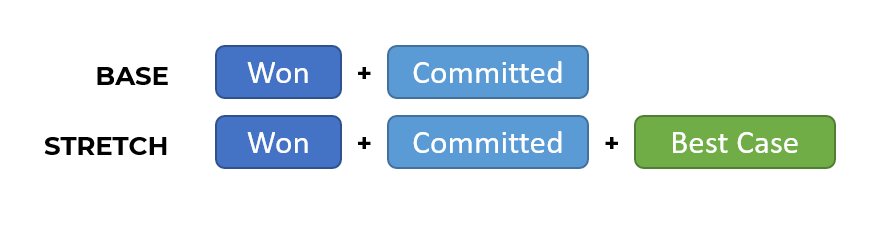
Stretch should include Best Case forecast categories
What is a Forecast Category?
Get out of the habit of forecasting based on the sales stage. If anything, the sales stage could reflect a probability but it’s much better to use the concept of forecast categories which allows you to have more discretion over which opportunities should be included. Here are the categories that are generally used:
- Won: Deals that are Closed Won
- Committed: Deals that have you have verbal and are actively engaged in legal or contracts.
- Best Case: These are your hopeful deals that essentially make up the difference between your base and stretch forecasts.
- Pipeline: These deals are your fodder. They shouldn’t be included in the base or stretch forecast, but it’s important to track ‘pipeline’ deals because they are your future ‘best case’ and ‘committed’ deals.
- Lost: Equally important to track lost deals as won deals.
- Omitted: These are real deals but you don’t want them to be included in a forecast for various reasons.
Each open deal should be categorized, have an accurate deal value, and have an estimated close date.
Which Money Value are you forecasting?
B2B SaaS have different numbers to value the deals:
- Total Contract Value includes software and one-time fees (ex-services) over the length of the term. (ex 3 years)
- Annual Contract Value is the first year’s value of the deal and includes all revenue including one-time fees.
- Annual Recurring Revenue, the most important revenue type, excludes one-time fees and represents the ARR amount that is added to the next fiscal year’s jump-off.
You could also be tracking base currency and native currencies in the case of companies that have foreign transactions. So take for example a “one million dollar deal”. That deal might be a three-year term with a $300,000 annual subscription, and $100,000 of services. In this case the ARR is $300,000; the TCV is $1,000,000, and the ACV is $400,000.
Setting up Forecasts
We would recommend setting up three different forecasts when forecasting your B2B SaaS Business. You might even consider forecasting Existing customer back to base deals separately from New Logo deals:
- ARR: Converting all deals to the base currency, use the ARR value for all opportunities except for Renewals. This forecast will give you your ARR bump for next year’s jump-off point.
- Contract Value: use the Annual Contract Value for all opportunities except for Renewals. This forecast will give you a good indication of the cash coming into the business.
- Renewals: Separate out your renewal forecast. They are a totally different sales motion. (Note, if you aren’t, you should be using opportunities to track your renewals! More on that another time).
Snapshots
As the quarter progresses, your visibility on how the quarter will shake out becomes more perfect. Take a snapshot of your forecast entering into the quarter. Your Won deals will be $0 and you’ll have predictions for Committed and Best Case. Take another snapshot of your forecast with 30-45 days remaining. You should hopefully have a few committed deals move to Won, and more accuracy on the remaining days of the quarter. Take a prediction at each snapshot so you can compare how accurate you are. This will show you how accurate your forecasting is over time. It’s a telling exercise and will help you become more objective.
Tips to Managing the Forecast
Hold weekly meetings with your reps or your reps or sales managers. Forecasting your B2B SaaS Business, go through each deal and look for:
- Last Activity & Next Activity. What was the last activity, how long ago was it? Is the next activity defined? Is it agreed to by the buyer?
- Competitors & Stakeholders. If anything this is a good indication of how well your rep knows what’s happening on a deal.
- How quickly did the deal leave the first sales stage? If a deal sat in the first stage for a year, it has a lower probability of closing. If it flew through the first stage, that’s a good indication the deal is slippery. Velocity is really important.
- How engaged is the buyer? How often is the buyer communicating with your rep? When was the last email?
- Products & Pricing? Was a proposal delivered? Did your rep load up products into the opportunity, or simply jam in a deal value manually? If they did so manually, it’s probably an indication the deal is not mature as yet.
- Close Date. I don’t like to have an estimated close date as a mandatory field until the opportunity matures to a later sales stage. It promotes garbage data. All your deals will magically close on “Dec 31”. Let the rep create an opportunity without a close date but require it at later stages.
If you have too many deals to look through with your rep, focus on four things:
- Which deals were lost since the last review?
- How many new opportunities were created since the last review?
- What can we expect to close in the next week?
- Did anything go quiet after a major event (ex. Demo, proposal, agreement)?
There is no point reviewing deals won because those are well celebrated when they occur.
On your opportunity form, make it easy for the sales manager to identify key information.
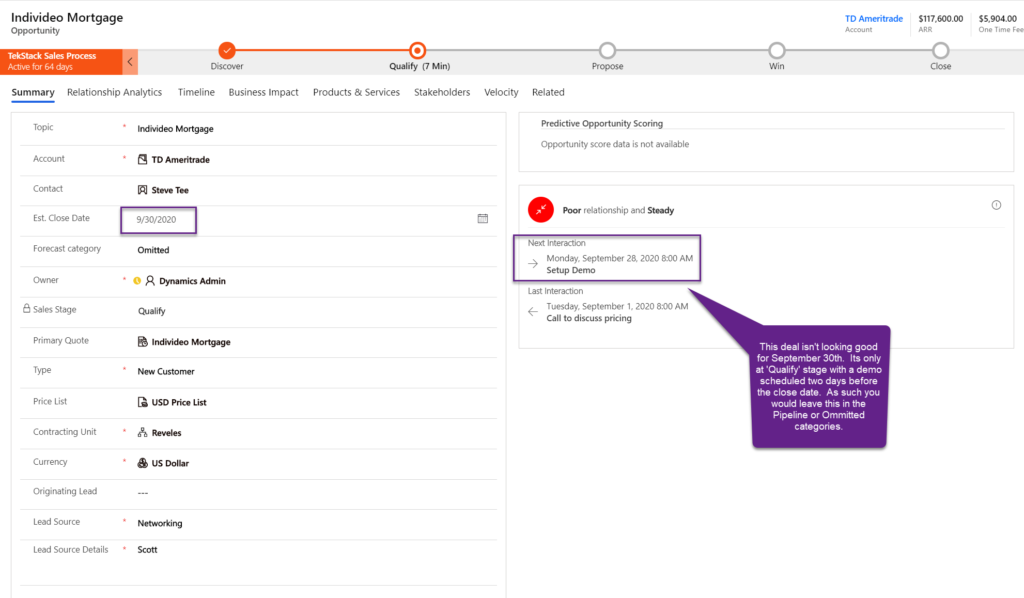
Show next step and last step. Compare to the sales stage and Estimated Close date to determine forecast category.
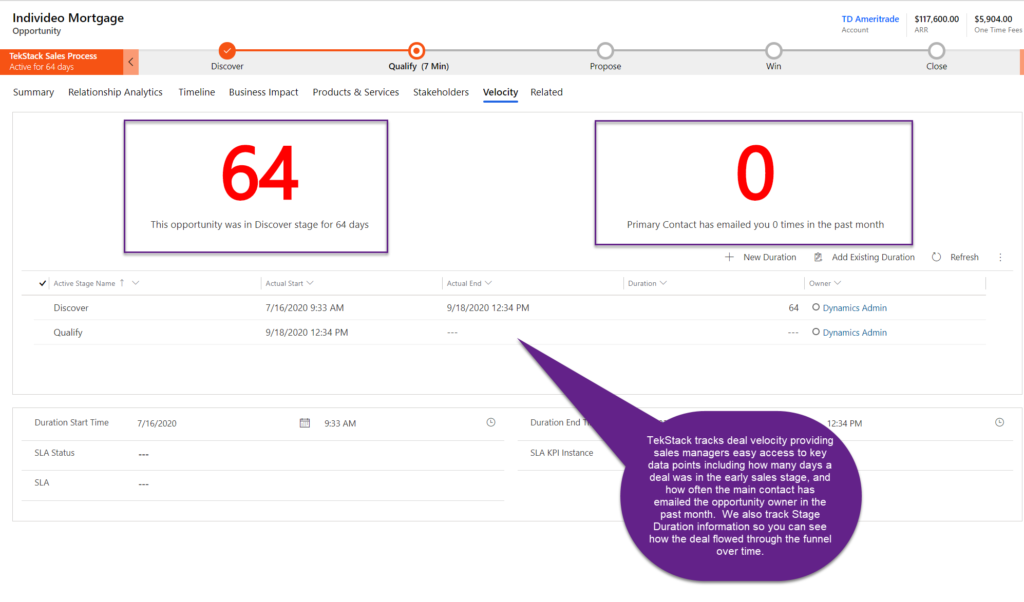
Velocity data like days in the early stage, or contact engagement are predictors of deal success.
Visualizing the Forecast
Forecasting your B2B SaaS Business, two of the most useful visualizations for forecasting include trend analysis and Sankey flow diagrams. Trend analysis shows you how each forecast category moves over time. Sankey flow diagrams show the movement of deals between two snapshots in time.
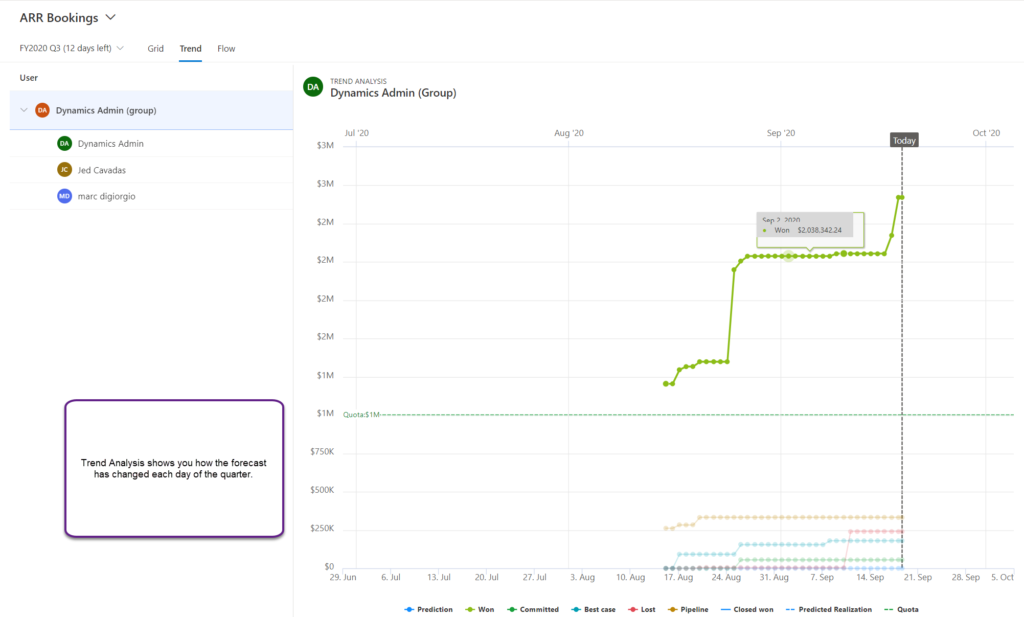
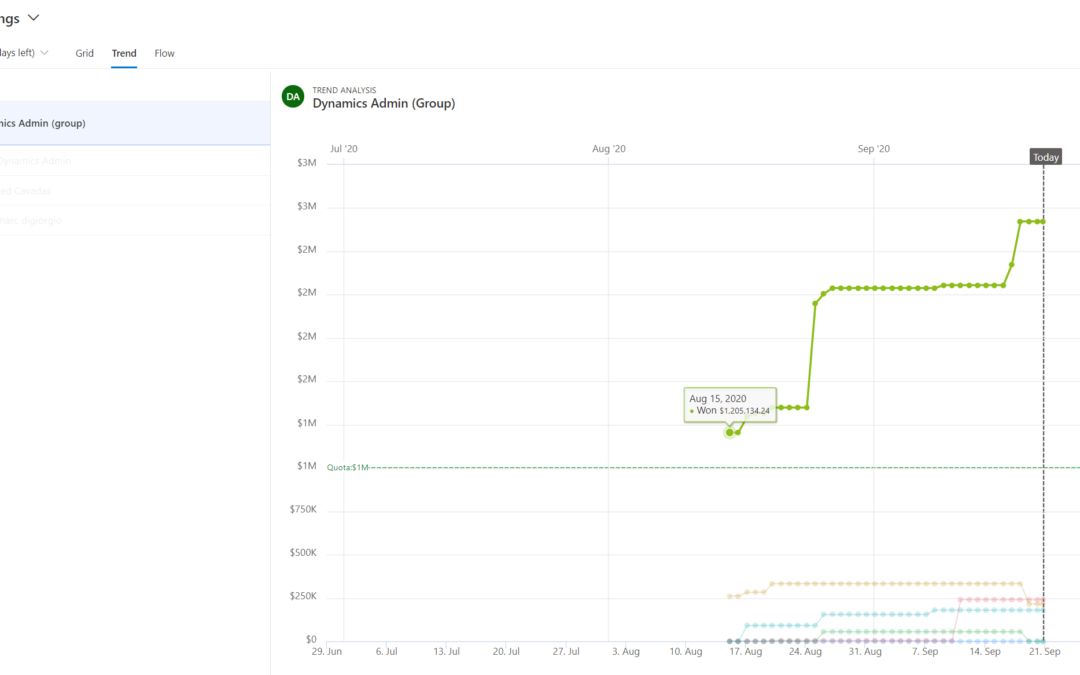
Trend Analysis shows how deals move through the quarter
In the example of the Sankey flow diagram above, you can see that 14 of the deals that entered into the funnel since the August 15th snapshot have been Won totaling $1.22M of ARR. It’s a great way to answer questions like how many of my Committed deals didn’t go to Won since our last snapshot. Also, of my Lost deals, how many were predicted as Best Case or Committed? Ideally, the answer is none and your lost deals were Pipeline.
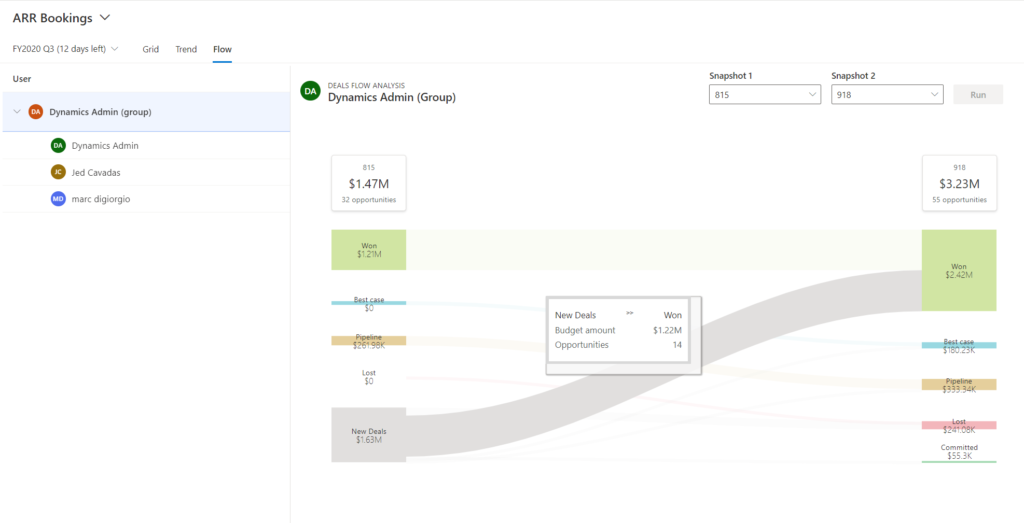
A Sankey flow diagram is very useful when visualizing your forecast. It shows you changes to your funnel between forecast snapshots.
Here is a little video of how TekStack helps customers improve their forecasting accuracy.


Recent posts